![[NetBSD Logo]](/tnf/resource/NetBSD-headerlogo.png)
GSoC 2016 Reports: Split debug symbols for pkgsrc builds, part 1
For the 10th time The NetBSD Foundation was selected for the GSoC 2016!
Now that we're near the first mid-term evaluation and have written the code during these weeks it's also the right time to start writing some reports regarding our projects in this series of blog posts.
About Split debug symbols for pkgsrc builds GSoC project
As part of Split debug symbols for pkgsrc builds GSoC project I'm
working to provide support for pkgsrc packages for splitted packages that just
contain debug symbols for their correspondent package (e.g. for the
foo-0.1.2.tgz package there will be a corresponding
foo-0.1.2-debugpkg.tgz package that just contains stripped debug
symbols of all the former binaries and libraries installed by
foo-0.1.2).
If you're more curious and you would like to know more information about it please take a look to the proposal.
Introduction
In this blog post we will learn how debug information are stored and stripped
off from the programs and/or libraries. We will first write a simple program and
a Makefile to analyze what MKDEBUG* flags in NetBSD do. Then we will take a look more in
depth to how everything is implemented in the various src/share/*.mk
files and at the end we will give a look to related works already implemented in
RPM and dpkg.
A pretty long list of references is also provided for the most curiouses readers!
A quick introduction to ELF and how debug information are stored/stripped off
In order to become familiar with ELF format a good starting point are Object file and Executable and Linkable Format pages from Wikipedia, the free encyclopedia.
Trying to describe ELF format is not easy in short terms so, it is strongly suggested to read the nice article series written by Eric Youngdale for Linux Journal: The ELF Object File Format: Introduction and The ELF Object File Format by Dissection. Please note that these two resources should be enough to completely understand this blog post!
After reading the above resources we have just learned that every programs and libraries in NetBSD (and several other Unix-like operating systems) uses the ELF format. There are four types of ELF object files:
- executable
- relocatable
- shared
- core
For more information regarding them please give a look to elf(5).
We are interested to understand what happens when we compile the
programs/libraries with debugging options (basically the -g option).
NetBSD already supports everything out of the box and so we can quickly start
looking at it just writing a simple Makefile and a program that will print the
lyrics of the famous Ten Green Bottles song! To avoid all the hassle of
providing (multiple times!) the right flags to the compiler and manually
invoke the right tool we can just write a very simple Makefile that will do
everything for us:
$ cat green-bottles/Makefile
#	$NetBSD$

NOMAN=	# defined

PROG=	green-bottles

.include <bsd.prog.mk>
Now that we have the Makefile we can start writing the green-bottles PROGram
(please note that all the green bottles accidentally fall were properly
recycled during the writing of this article):
$ cat green-bottles/green-bottles.c
#include <stdio.h>

void
sing_green_bottles(int n)
{
	const char *numbers[] = { "no more", "one", "two", "three", "four", "five",
	    "six", "seven", "eight", "nine", "ten" };

	if ((1 <= n) && (n <= 10)) {
		printf("%s green bottle%s hanging on the wall\n",
		    numbers[n], n > 1 ? "s" : "");
		printf("%s green bottle%s hanging on the wall\n",
		    numbers[n], n > 1 ? "s" : "");
		printf("and if %s green bottle should accidentally fall,\n",
		    n > 2 ? "one" : "that");
		printf("there'll be %s green bottles hanging on the wall.\n",
		    numbers[n - 1]);
	}

	return;
}


/*
 * Sing the famous `Ten Green Bottles' song.
 */
int
main(void)
{
	int i;

	for (i = 10; i > 0; i--) {
		sing_green_bottles(i);
	}

	return 0;
}
OK! Now everything is ready and if we just invoke make(1) we'll build the program. However, we would like to inspect what's happening behind the scenes, so we'll look at each steps. Please note that right now it is not important that you'll understand everything because we'll look at what make(1) magic do in more details later.
First, we compile the C program to generate the relocatable object file, i.e.
green-bottles.o:
$ cd green-bottles/
$ make green-bottles.o
#   compile  green-bottles/green-bottles.o
gcc -O2 -fPIE    -std=gnu99   -Werror     -c    green-bottles.c
ctfconvert -g -L VERSION green-bottles.o
Let's see what file(1) says regarding it:
$ file green-bottles.o
green-bottles.o: ELF 64-bit LSB relocatable, x86-64, version 1 (SYSV), not stripped
In order to get more information we can use readelf(1) tool provided by the
binutils (GNU binary utilities),
e.g. via readelf -h (the -h option is used
to just print the file headers, if you would like to get more information you
can use the -a option instead):
$ readelf -h green-bottles.o
ELF Header:
  Magic:   7f 45 4c 46 02 01 01 00 00 00 00 00 00 00 00 00
  Class:                             ELF64
  Data:                              2's complement, little endian
  Version:                           1 (current)
  OS/ABI:                            UNIX - System V
  ABI Version:                       0
  Type:                              REL (Relocatable file)
  Machine:                           Advanced Micro Devices X86-64
  Version:                           0x1
  Entry point address:               0x0
  Start of program headers:          0 (bytes into file)
  Start of section headers:          2816 (bytes into file)
  Flags:                             0x0
  Size of this header:               64 (bytes)
  Size of program headers:           0 (bytes)
  Number of program headers:         0
  Size of section headers:           64 (bytes)
  Number of section headers:         17
  Section header string table index: 13
We can see the 17 sections always via readelf (-S option).
Now let's recompile it but via the debugging options turned on:
$ make green-bottles.o MKDEBUG=yes
#   compile  green-bottles/green-bottles.o
gcc -O2 -fPIE  -g   -std=gnu99   -Werror     -c    green-bottles.c
ctfconvert -g -L VERSION -g green-bottles.o
If we are careful we can see that unlike the previous make incantation now the
-g option is passed to the compiler... Let's see if we can inspect that via
readelf:
$ readelf -h green-bottles.o
ELF Header:
  Magic:   7f 45 4c 46 02 01 01 00 00 00 00 00 00 00 00 00
  Class:                             ELF64
  Data:                              2's complement, little endian
  Version:                           1 (current)
  OS/ABI:                            UNIX - System V
  ABI Version:                       0
  Type:                              REL (Relocatable file)
  Machine:                           Advanced Micro Devices X86-64
  Version:                           0x1
  Entry point address:               0x0
  Start of program headers:          0 (bytes into file)
  Start of section headers:          6424 (bytes into file)
  Flags:                             0x0
  Size of this header:               64 (bytes)
  Size of program headers:           0 (bytes)
  Number of program headers:         0
  Size of section headers:           64 (bytes)
  Number of section headers:         29
  Section header string table index: 25
We can note several differences compared to the previous relocatable file
compiled without MKDEBUG:
- Start of section headers (previously 2816, now 6424)
- Number of section headers (previously 17, now 29)
- Section header string table index (previously 13, now 25)
If we compare the sections between the two relocatable files (tips: using:
readelf -WS green-bottles.o | sed -nEe 's/^ \[ *([0-9]+)\] ([^ ]*) .*/\2/p'
is a possible way to do it) we can observe the following new ELF sections:
-
.debug_info: contains main DWARF DIEs (Debugging Information Entry) -
.debug_abbrev: contains abbreviations used in.debug_infosection -
.debug_loc: contains location expressions -
.debug_aranges: contains a table for lookup by addresses of program entities (i.e. data objects, types, functions) -
.debug_ranges: contains address ranges referenced by DIEs -
.debug_line: contains line number program -
.debug_str: contains all strings referenced by.debug_info -
other
.rela.debug_*
It's time to finally build the program:
$ make green-bottles
rm -f .gdbinit
touch .gdbinit
#      link  green-bottles/green-bottles
gcc     -pie  -shared-libgcc      -o green-bottles  green-bottles.o  -Wl,-rpath-link,/lib  -L=/lib
ctfmerge -t -g -L VERSION -o green-bottles green-bottles.o
We can observe:
$ readelf -h green-bottles
ELF Header:
  Magic:   7f 45 4c 46 02 01 01 00 00 00 00 00 00 00 00 00
  Class:                             ELF64
  Data:                              2's complement, little endian
  Version:                           1 (current)
  OS/ABI:                            UNIX - System V
  ABI Version:                       0
  Type:                              DYN (Shared object file)
  Machine:                           Advanced Micro Devices X86-64
  Version:                           0x1
  Entry point address:               0x730
  Start of program headers:          64 (bytes into file)
  Start of section headers:          6448 (bytes into file)
  Flags:                             0x0
  Size of this header:               64 (bytes)
  Size of program headers:           56 (bytes)
  Number of program headers:         7
  Size of section headers:           64 (bytes)
  Number of section headers:         31
  Section header string table index: 27
...and for its counterpart compiled via MKDEBUG=yes:
$ readelf -h green-bottles
ELF Header:
  Magic:   7f 45 4c 46 02 01 01 00 00 00 00 00 00 00 00 00
  Class:                             ELF64
  Data:                              2's complement, little endian
  Version:                           1 (current)
  OS/ABI:                            UNIX - System V
  ABI Version:                       0
  Type:                              DYN (Shared object file)
  Machine:                           Advanced Micro Devices X86-64
  Version:                           0x1
  Entry point address:               0x730
  Start of program headers:          64 (bytes into file)
  Start of section headers:          8304 (bytes into file)
  Flags:                             0x0
  Size of this header:               64 (bytes)
  Size of program headers:           56 (bytes)
  Number of program headers:         7
  Size of section headers:           64 (bytes)
  Number of section headers:         38
  Section header string table index: 34
Not so surprisingly the number of the 7 extra sections are exactly the
.debug_* ones!
Now that it's clear the difference between the program compiled with/without
-g option let's see what happen when the debug symbols are stripped off the
program:
$ make green-bottles.debug MKDEBUG=yes
#    create  green-bottles/green-bottles.debug
(  objcopy --only-keep-debug green-bottles green-bottles.debug  && objcopy --strip-debug -p -R .gnu_debuglink  --add-gnu-debuglink=green-bottles.debug green-bottles  ) || (rm -f green-bottles.debug; false)
We can try to describe what happened with an image:
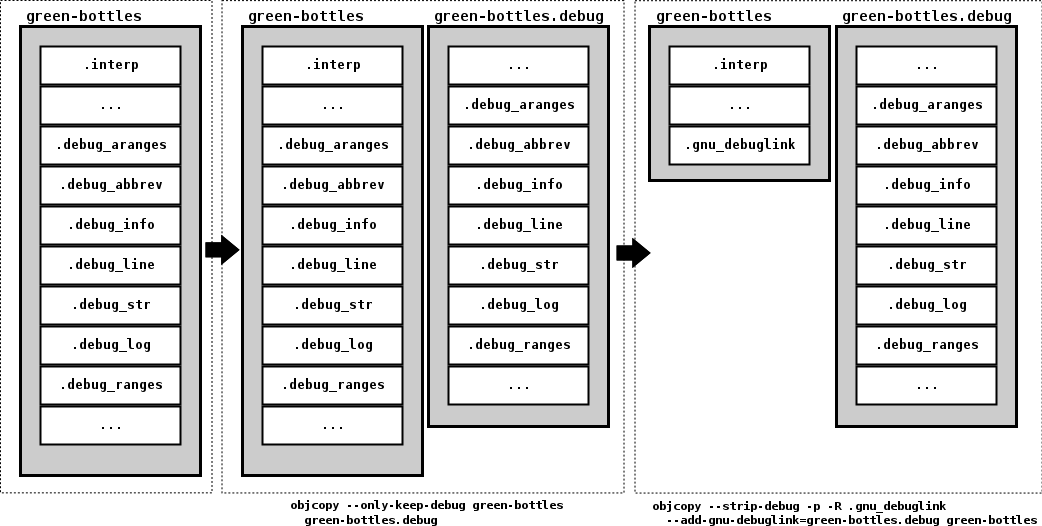
The first objcopy(1)
incantation generate the green-bottles.debug
file.
The second objcopy(1)
incantation strip the debug symbols off
green-bottles (now that they're stored in
green-bottles.debug they are no more needed) and add the
.gnu_debuglink ELF section to it.
Let's quickly look them via file(1):
$ file green-bottles green-bottles.debug
green-bottles:       ELF 64-bit LSB shared object, x86-64, version 1 (SYSV), dynamically linked, interpreter /usr/libexec/ld.elf_so, for NetBSD 7.99.29, not stripped
green-bottles.debug: ELF 64-bit LSB shared object, x86-64, version 1 (SYSV), dynamically linked, interpreter *empty*, for NetBSD 7.99.29, not stripped
Using readelf we can note that now green-bottles has 32 sections and
green-bottles.debug has 38 sections. green-bottles has one extra section that
was added by the objcopy(1) incantation, let's see it:
$ readelf -x '.gnu_debuglink' green-bottles

Hex dump of section '.gnu_debuglink':
  0x00000000 67726565 6e2d626f 74746c65 732e6465 green-bottles.de
  0x00000010 62756700 90b06f1c                   bug...o.
The .gnu_debuglink section contain the basename(3) of the .debug file and
its CRC32. The .gnu_debuglink section is used to properly pick the correct
.debug file from the DEBUGDIR directory (we'll see how it will work later when
we will invoke the GNU debugger).
Regarding the sections in the .debug file all of them are preserved but several
have no data, we can check that by invoking:
$ readelf `seq -f '-x %g' 0 37` green-bottles.debug
$ readelf `seq -f '-x %g' 0 31` green-bottles
...and comparing their respective output.
Now that everything should be clearer we can just try to invoke it through gdb(1) and see what happens:
$ gdb ./green-bottles
GNU gdb (GDB) 7.10.1
Copyright (C) 2015 Free Software Foundation, Inc.
License GPLv3+: GNU GPL version 3 or later <http://gnu.org/licenses/gpl.html>
This is free software: you are free to change and redistribute it.
There is NO WARRANTY, to the extent permitted by law.  Type "show copying"
and "show warranty" for details.
This GDB was configured as "x86_64--netbsd".
Type "show configuration" for configuration details.
For bug reporting instructions, please see:
<http://www.gnu.org/software/gdb/bugs/>.
Find the GDB manual and other documentation resources online at:
<http://www.gnu.org/software/gdb/documentation/>.
For help, type "help".
Type "apropos word" to search for commands related to "word"...
Reading symbols from ./green-bottles...Reading symbols from /tmp/green-bottles/green-bottles.debug...done.
done.
(gdb) b main
Breakpoint 1 at 0xac0: file green-bottles.c, line 29.
(gdb) b sing_green_bottles
Breakpoint 2 at 0x940: file green-bottles.c, line 5.
(gdb) run
Starting program: /tmp/green-bottles/green-bottles

Breakpoint 1, main () at green-bottles.c:29
29      {
(gdb) n
32              for (i = 10; i > 0; i--) {
(gdb) n
33                      sing_green_bottles(i);
(gdb) print i
$1 = 10
(gdb) cont
Continuing.

Breakpoint 2, sing_green_bottles (n=10) at green-bottles.c:5
5       {
(gdb) bt
#0  sing_green_bottles (n=10) at green-bottles.c:5
#1  0x00000000b7802ad7 in main () at green-bottles.c:33
[... we can now looks and debug it as we wish! ...]
So we can see that the green-bottles.debug file is loaded from the same
directory where green-bottles program was present (in our case
/tmp/green-bottles/ but if a corresponding file .debug is not
found gdb look for it in the DEBUGDIR, i.e. /usr/libdata/debug/;
e.g. for /usr/bin/yes it will look for debug symbols in
/usr/libdata/debug//usr/bin/yes.debug).
This is the same for all other programs and libraries.
A look to what MKDEBUG and MKDEBUGLIB do
NetBSD already provides MKDEBUG and MKDEBUGLIB mk.conf(5) variables to achieve the
separation of the debug symbols. They respectively split symbols from programs
and libraries.
The implementation to do that is in src/share/mk/bsd.prog.mk (for programs) and src/share/mk/bsd.lib.mk (for libraries). Several global variables used are defined in src/share/mk/bsd.own.mk.
bsd.prog.mk
In bsd.prog.mk:58
if MKDEBUG is defined and not "no" [sic] the -g flag is
added to CFLAGS.
In bsd.prog.mk:310
the internal __progdebuginstall make target is defined to
install the .debug file for the respective program. It is then called from
bsd.prog.mk:589
and bsd.prog.mk:604
(respectively for MKUPDATE == "no" and MKUPDATE != "no", please note
the dependency operators ! vs : for the two cases).
In bsd.prog.mk:437
_PROGDEBUG.${_P} is defined as ${PROGNAME.${_P}}.debug,
inside a for loop. ${_P} is just an element of the ${PROGS} and ${PROGS_CXX}
lists.
E.g.: for src/bin/echo
echo is the PROG value. bsd.prog.mk
turns single-program PROG and PROG_CXX variable into the multi-word PROGS and
PROGS_CXX variables.
In bsd.prog.mk:545
there is the most important part. After checking if
_PROGDEBUG.${_P} is defined a ${_PROGDEBUG.${_P}} target is defined and
${OBJCOPY} is invoked two times. In the first incantation the
${_PROGDEBUG.${_P}} file (containing the strip debug symbols) is generated for
${_P}. The second incantation is needed to get rid of (now no more needed) debug
symbols from ${_P} and --add-gnu-debuglink add a .gnu_debuglink section to
${_P} containing the filename of the ${_PROGDEBUG.${_P}}; e.g. for echo it
will be echo.debug (plus the CRC32 of echo.debug - padded as needed).
Regarding other options used by ${OBJCOPY} we should note the -p option needed
to preserve dates and -R is added in order to be sure to update the
.gnu_debuglink section.
For a gentler introduction and to understand why these steps are needed please
read (gdb.info)Separate Debug Files
(you can just use info(1), i.e. info
'(gdb.info)Separate Debug Files').
bsd.lib.mk
The logic and objcopy(1)
incantation are similar to the ones used in
bsd.prog.mk.
The most interesting part is in bsd.lib.mk:622.
Apart the *.debug
files if MKDEBUGLIB is defined and not "no" [sic] also *_g.a archives are
created for the respective libraries archives (although they are stored
directly in the several lib/ directories not in /usr/libdata/debug/).
bsd.own.mk
In bsd.own.mk
various DEBUG* variables are defined:
-
DEBUGDIR: where*.debugfiles are stored. Please notice that this is also the place where debugging symbols are looked (for more information please give a look to objcopy(1)) -
DEBUGGRP: the-goption passed to install(1) for installing debug symbols -
DEBUGOWN: the-ooption passed to install(1) for installing debug symbols -
DEBUGMODE: the-moption passed to install(1) for installing debug symbols
Related works
dpkg
The Debian Developer's Reference
written by the Developer's Reference Team
has a
Best practices for debug packages (section 6.7.9).
The logic used is more or less the same of the one used by src/share/mk in
NetBSD and described above.
After a quick inspection of
dh_strip
(part of debhelper package) some interesting ideas to look further are:
-
the file(1) logic used in
testfile()subroutine -
handling of non-C/C++ programming languages: OCaml native code shared
libraries (
*.cmxs) and nodejs binaries (*.node)
RPM
The Fedora Project Wiki contains some interesting tips, in particular regarding most common issues that happens in stripping debugging symbols in the Packaging:Debuginfo page. Some of the logic is handled in find-debuginfo.sh.
Another interesting resource is the
Releases/FeatureBuildId page.
The page discusses what Red Hat have done regarding using the .note.gnu.build-id
section and why have done them.
(Yet another) interesting idea adopted by Fedora developers is the
Features/MiniDebugInfo.
More information regarding MiniDebugInfo are also present in
(gdb.info)MiniDebugInfo.
Please note that this is not completely related to
stripping debugging symbols (indeed the MiniDebugInfo is directly stored in
program/library!) but can be considered in order to provide better .core (both
in the pkgsrc and NetBSD cases).
Mark J. Wielaard presented in FOSDEM 2016 a talk that summarizes many of the thematics discussed in this diary. Abstract, video recording and more resources are available in the FOSDEM website correspective event page: Where are your symbols, debuginfo and sources?. Apart his talk a very interesting reading is his blog post regarding the talk. In the blog post there are a lot of interesting information, all worth to be taken in consideration also for the pkgsrc case.
Conclusion
In this blog post we have learned what's happening when we use
MKDEBUG*
mk.conf(5) variables
and how everything works.
We have also gave a quick look to other related works, in particular
RPM and dpkg package managers.
If you are curious on what I'm doing right now and you would like to also look at the code you can give a look to the git pkgsrc repository repository fork in the debugpkg branch.
Apart the several references discussed above if you would like to learn more
about several aspects that wasn't discussed there...
Introduction to the DWARF Debugging Format
written by Michael Eager
is a good starting point for DWARF (debugging data format); you can also use
objdump -g to show these information in the *.debug
files.
Regarding GDB a
gentle introduction to it is
Using GNU's GDB Debugger
by Peter Jay Salzman.
I would like to thanks Google for organizing Google Summer of Code and The NetBSD Foundation, without them I would not be able to work on this project!
A particular and big thank you goes to my mentors David Maxwell, Jöerg Sonnenberger, Taylor R. Campbell, Thomas Klausner and William J. Coldwell for the invaluable help, guidance and feedbacks they're providing!
References
- The ELF Object File Format: Introduction, Eric Youngdale
- The ELF Object File Format by Dissection, Eric Youngdale
- Tool Interface Standard (TIS) Executable and Linking Format (ELF) Specification Version 1.2, TIS Committee
- DWARF Debugging Information Format Version 4, DWARF Debugging Information Format Committee
- Introduction to the DWARF Debugging Format, Michael Eager
- Debugging with GDB Tenth Edition for GDB Version 7.10.1, Free Software Foundation, Inc.
- Using GNU's GDB Debugger, Peter Jay Salzman
- Debian Developer's Reference, Developer's Reference Team
- Where are your Symbols, Debuginfo and Sources?, Mark J. Wielaard
- make(1)
- elf(5)
- file(1)
- gcc(1)
- readelf(1)
- objdump(1)
- objcompy(1)
- gdb(1)
- src/share/bsd.README, 1.353
- src/share/bsd.prog.mk, 1.299
- src/share/bsd.lib.mk, 1.367
- src/share/bsd.own.mk, 1.927